During the coronavirus lockdown, we have witnessed many different aspects of life. Being at home and managing every essential on a digital platform rather than a conventional one has not only saved our time but also kept us safe from the virus effect.
With speedy digital adaptation of offline services, many online service providers have solidified their audience and user base in just a fraction of time.
What does OTT mean and, what is its success story?
- In simple words, Over The Top service supports video, audio, and live streaming content. It is supported by an internet connection, without subscribing to the traditional cable network.
- The core reason for the highest rankings is the closure of traditional entertainment avenues during the pandemic. OTT grabbed eyeballs and interest from the masses by adding original, offbeat and international content in its basket. Suspenseful drama series, documentaries, exciting live tournaments, films exclusively released on the OTT platforms made everyone make a beeline for subscribing to not one but various platforms.
- Users got an easy-to-access platform, to catch movies and shows regardless of geo boundaries, and airing time. Device limitation being thrown out of the window with competitive costing of subscription plans made the deal sweeter.
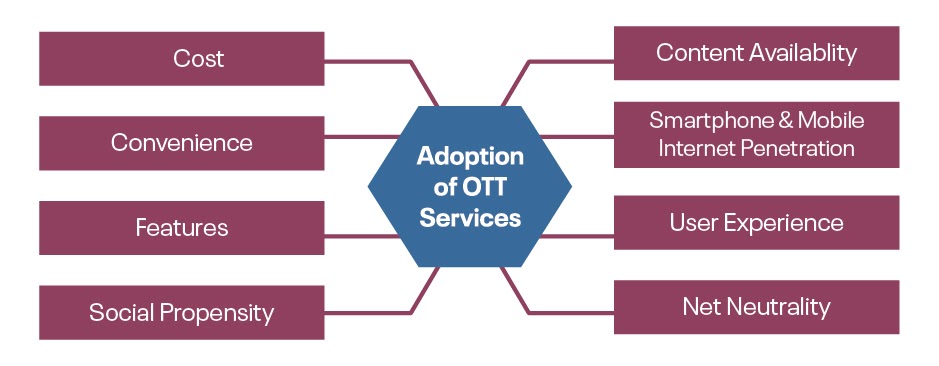
Some of the multimillionaire international platforms that have swiped away the audience base with their engaging video content are Netflix, Apple TV+, Amazon prime, Disney Plus, HBO now ,and a lot more. While, some of the trendsetters in the audio streaming industry are Spotify, Apple Music, Pandora Music, etc.

Future statistics of the power the next-gen OTT streaming platform holds-
The over-the-top online streaming industry is growing exponentially. For a clearer idea about the future growth of OTT, here are some of the streaming stats-
1- According to a report released by TechJury, the OTT streaming industry has shown a hike of around 99% between April 2019-April 2020. It is predicted that by 2027, the Over the Top streaming industry will be worth 184.27 billion USD.
2- Live streaming market is going to disclose its massive popularity by bringing its worth over $247 billion by 2027.
3- The number of OTT video service subscriptions is all set to be around 197.7 million by the end of 2022.
4- Live stream monetization strategies are considered one of the top sources for lead generation. Around 67% of the viewers watching the live streaming are convinced to buy the offered product & services.
Also read: Top OTT Industry Trends in 2021
All the stats show that the OTT industry is booming and is expected to show a growth rate of 50% in the near future. Most of the businesses which are into OTT services have already stabilized their operations and are doing well too.
But is it enough to survive in such an ever-growing easy to access platform? Being in an OTT streaming business, where your content is distributed all over the world, being accessed through different users, multiple devices, internet connections with fairly different internet speeds; it becomes essential to monitor and analyze performance of your services and OTT data to customize your monetization plan according to that.
How to Analyze Your OTT usage/user data?
To engage customers with engaging and informative content, OTT businesses have to plan a proper data-driven content strategy. Knowing which piece of content is best performing among your users, plays a vital role. When an organization decides which user base it is targeting and what kind of service is the most demanding for them, almost 60% of the fieldwork is covered; the other 20% is about marketing strategy.
- To get a data-driven intelligence report, the best-recommended way is to use data analytics. There are plenty of OTT data analysts service providers available in the market but it is always better to go for the one with a robust framework, support services and detailed analytics. . It helps in understanding content performance, charting out marketing road maps and eventually results in better lead generation and revenue growth.
MUVI is one of such professionally recommended OTT platform Analytics provider. MUVI Analytics reports are user-friendly and easy to assess for any technical and non-technical resource.
How MUVI streaming data analytics is helping OTT businesses in getting desired leads and revenue generation-
OTT Streaming data analytics provides detailed reports on revenue analytics, ugc revenue share, users, content, content partners, and custom reports in a downloadable file format.

Here are some of the frequent advantages OTT businesses are getting by analyzing the MUVI’s OTT data analytics report-
1-Revenue Generation-
By Assessing revenue analytics reports you can get an insight into total revenue achieved, subscription details, pay-per-view data, and physical order details.

With Revenue Analytics, it becomes easier to track annual revenue growth and select profitable monetization strategies for business.

2- Identify which User-generated content is giving the highest returns-
With UGC revenue share report, businesses can keep track of their user-generated content like upload numbers, purchase made from the uploads, purchase order id, total earnings from the user-generated content, content buyers’ names, states, etc.

By analyzing UGC revenue reports, businesses can keep track of the content source from which most of the buyers’ traffic is coming and how much each content piece is providing them. This data can be used in future projects to serve better solutions for the users who want to upload content on the OTT platforms.
3- Know your users and plan accordingly-
Users Analytics gives businesses a detailed insight into the number of total registrations done, number of free registration, number of PPV users, number of free users, user registration date, region, etc.

It helps track the registered users of the website and the future leads and clients, which the business can pitch in.
4- Track views, clicks and time spent on your content-
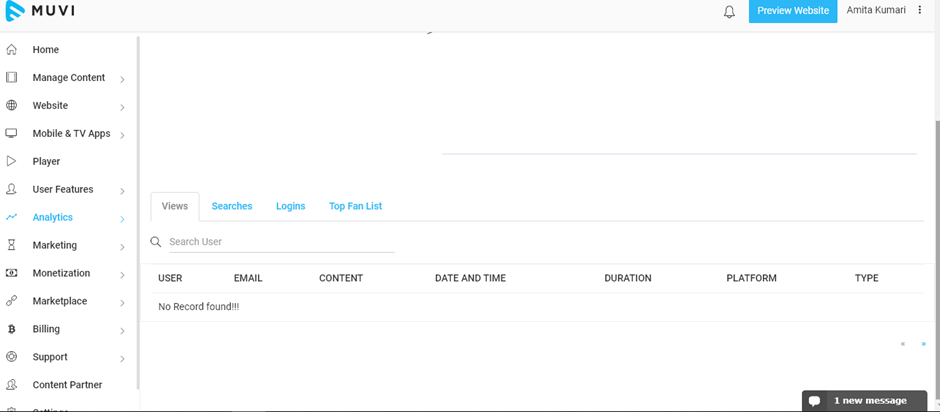
User action analytics helps businesses in getting insight into total views on the content on an hourly, monthly, and yearly basis.

The User Action reports include different categories of data about viewers’ names, login & logout time, email id, content viewed, date & time, duration of view, and platform on which the content is viewed. By analyzing which, a business can easily estimate which content is driving the most of the viewers’ traffic and plan content strategy accordingly.
5- Derive subscription revenue-
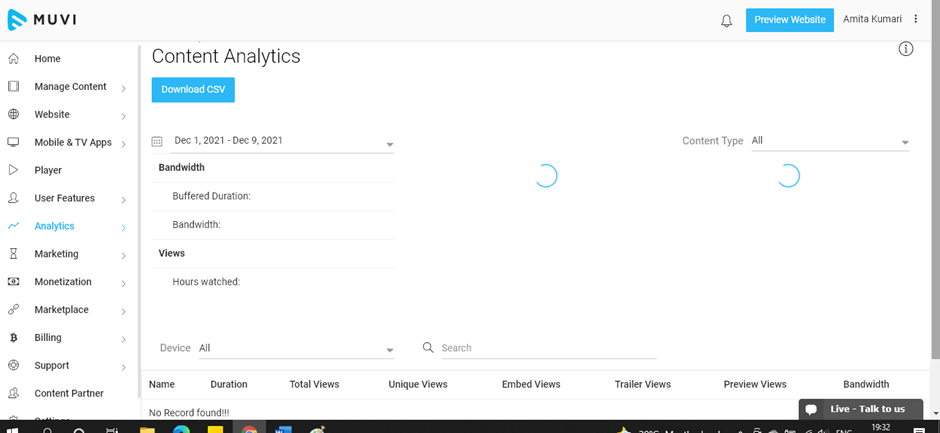
Muvi’s Content analytics report gives you insight into bandwidth consumed, buffered duration, unique view number, trailer views number, preview views number.
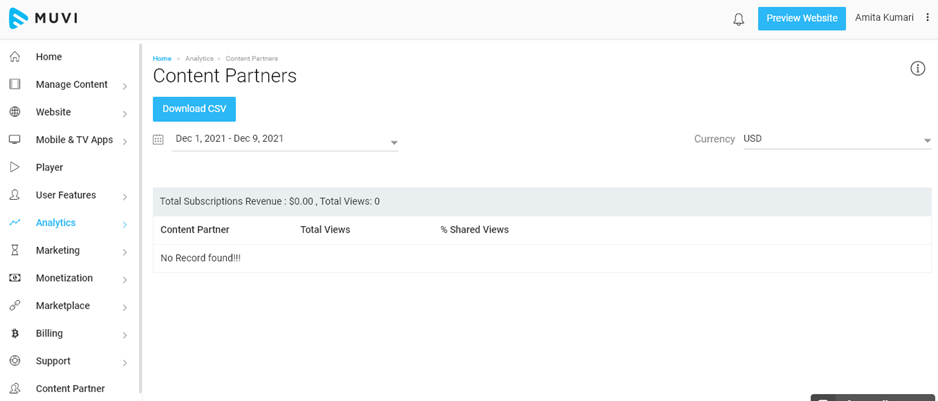
The content partner analytics report provides data about total subscription revenue, content partner names, total views, and % shared views.
6- Explore the efficiency of user generated content-
The user-generated content report provides numbers of user-generated content, number, name, email id of content uploaders, total views on the uploads, and comments received.
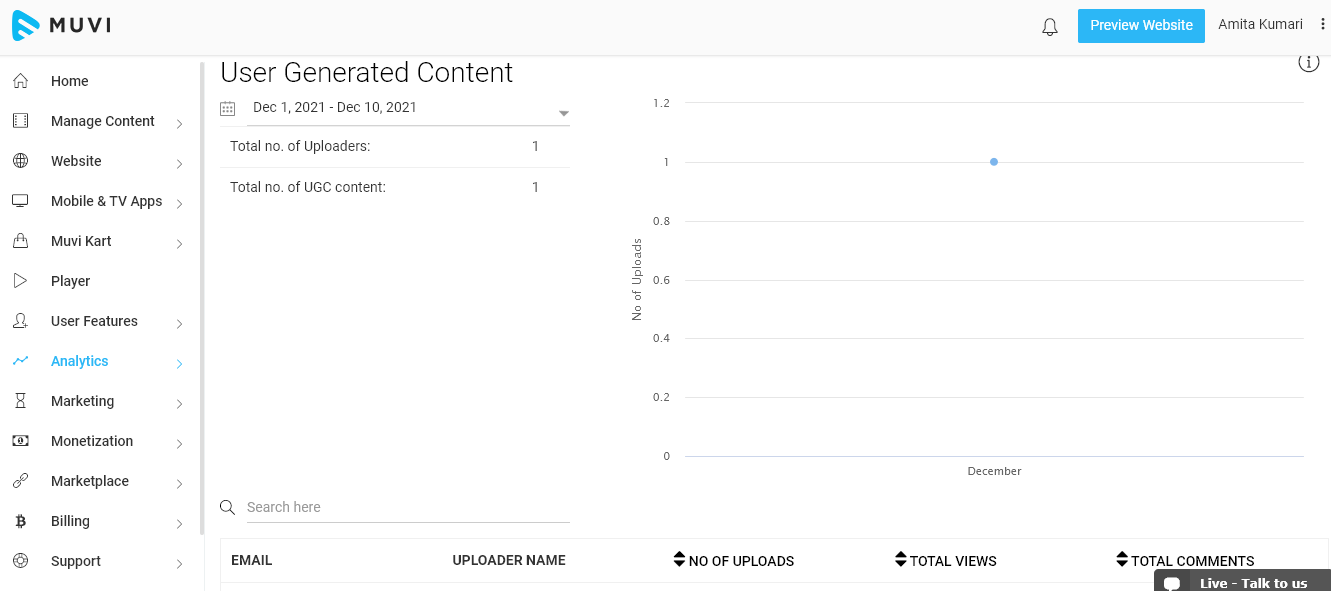
Analyzing user-generated content data helps businesses develop better promotion strategies to encourage their users to get content published on the website, eventually leading to drive engagement and lead conversions.
Take a 14-day free trial today to get started(no credit card needed)!







Add your comment